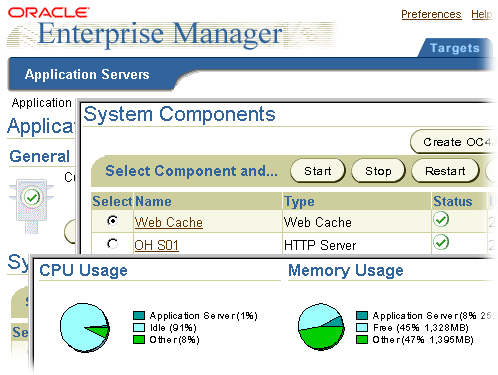
Oracle Enterprise Manager allows administrators to stop and restart Oracle9iAS instances from the Oracle9iAS Instance Home Page. They can also modify the configuration settings based on performance statistics collected to improve performance and scalability or to address any problems.
The console provides performance metrics for each component in both tabular and chart formats so you can identify problem conditions at a glance. When you drill down on an Oracle9i Application Server, you can view the status, historical uptime statistics, and the current performance and availability for each Oracle9iAS instance. Metrics vary from one component type to another, but typical metrics include:
|
 | Up/down status |
 | Memory usage |
 | Error rate |
 | Start time |
 | Number of connections |
|
|

|


